Trees & Forests
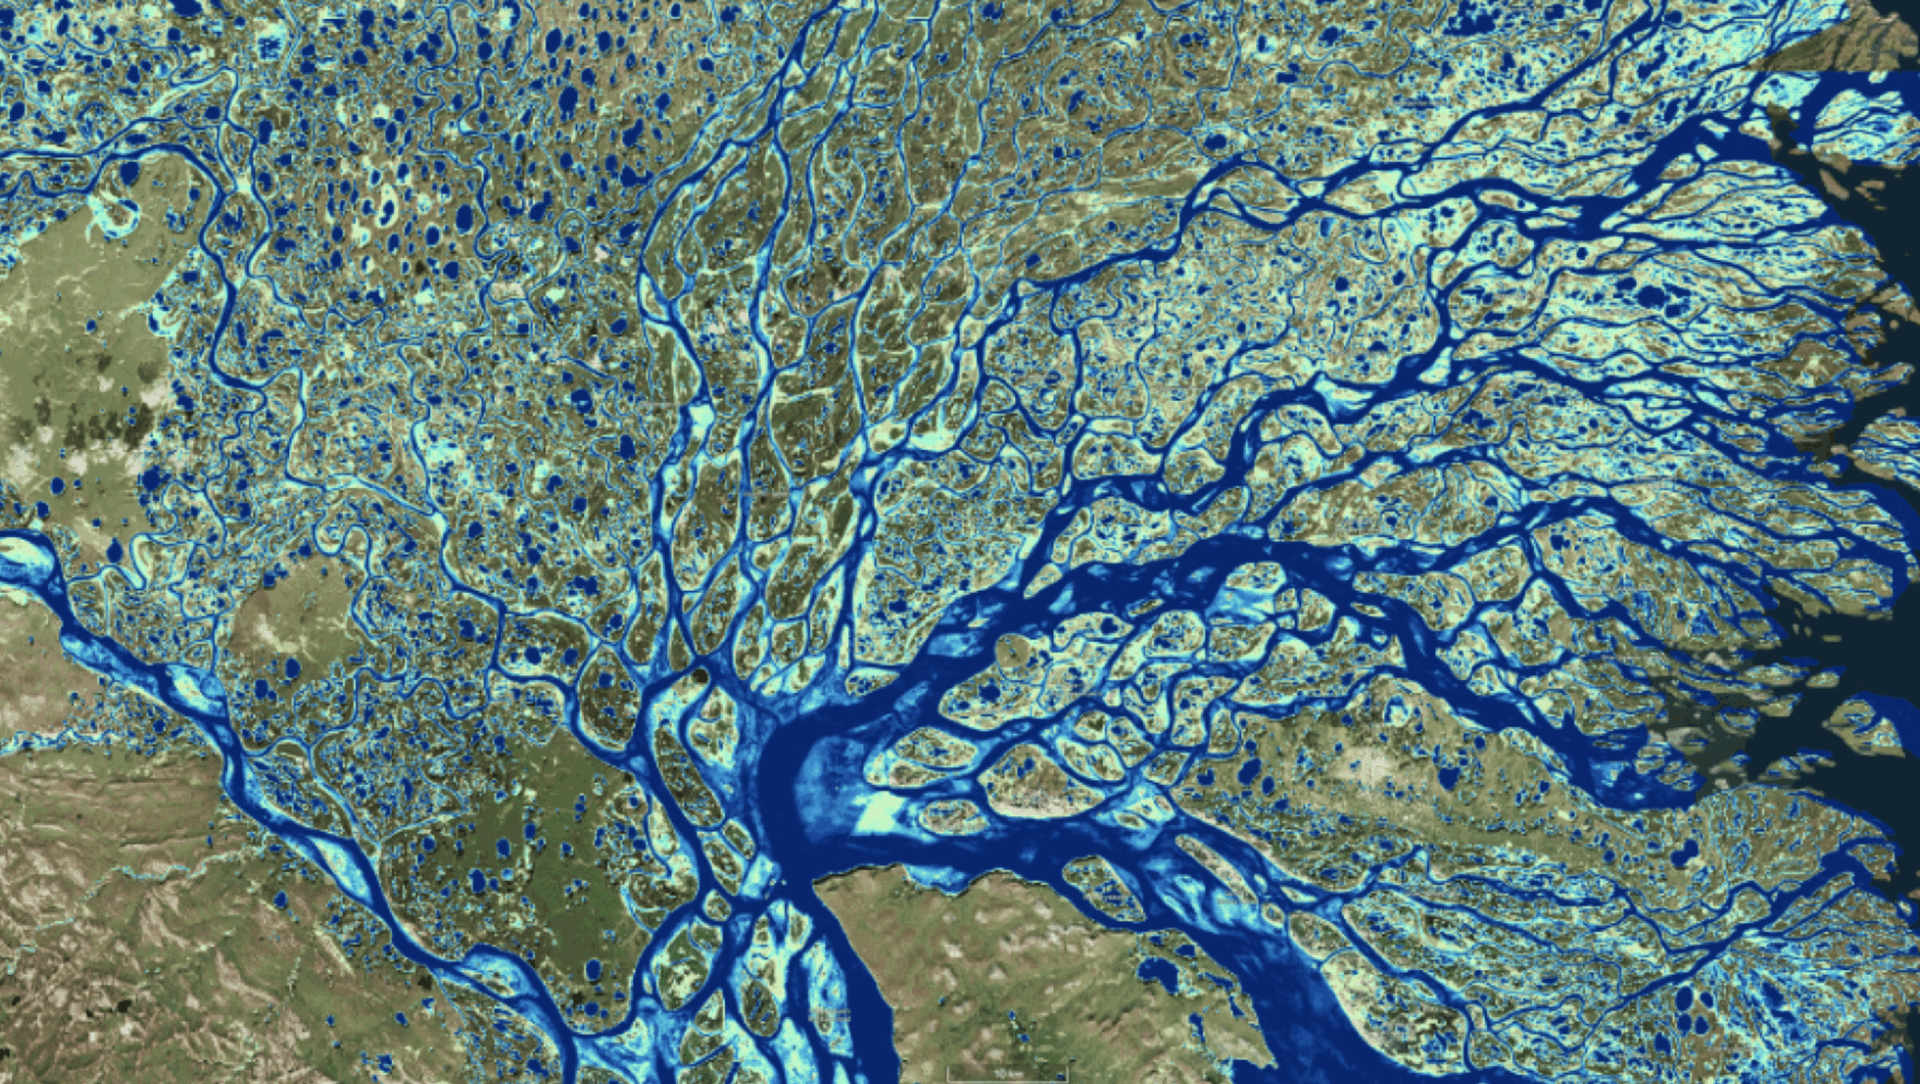
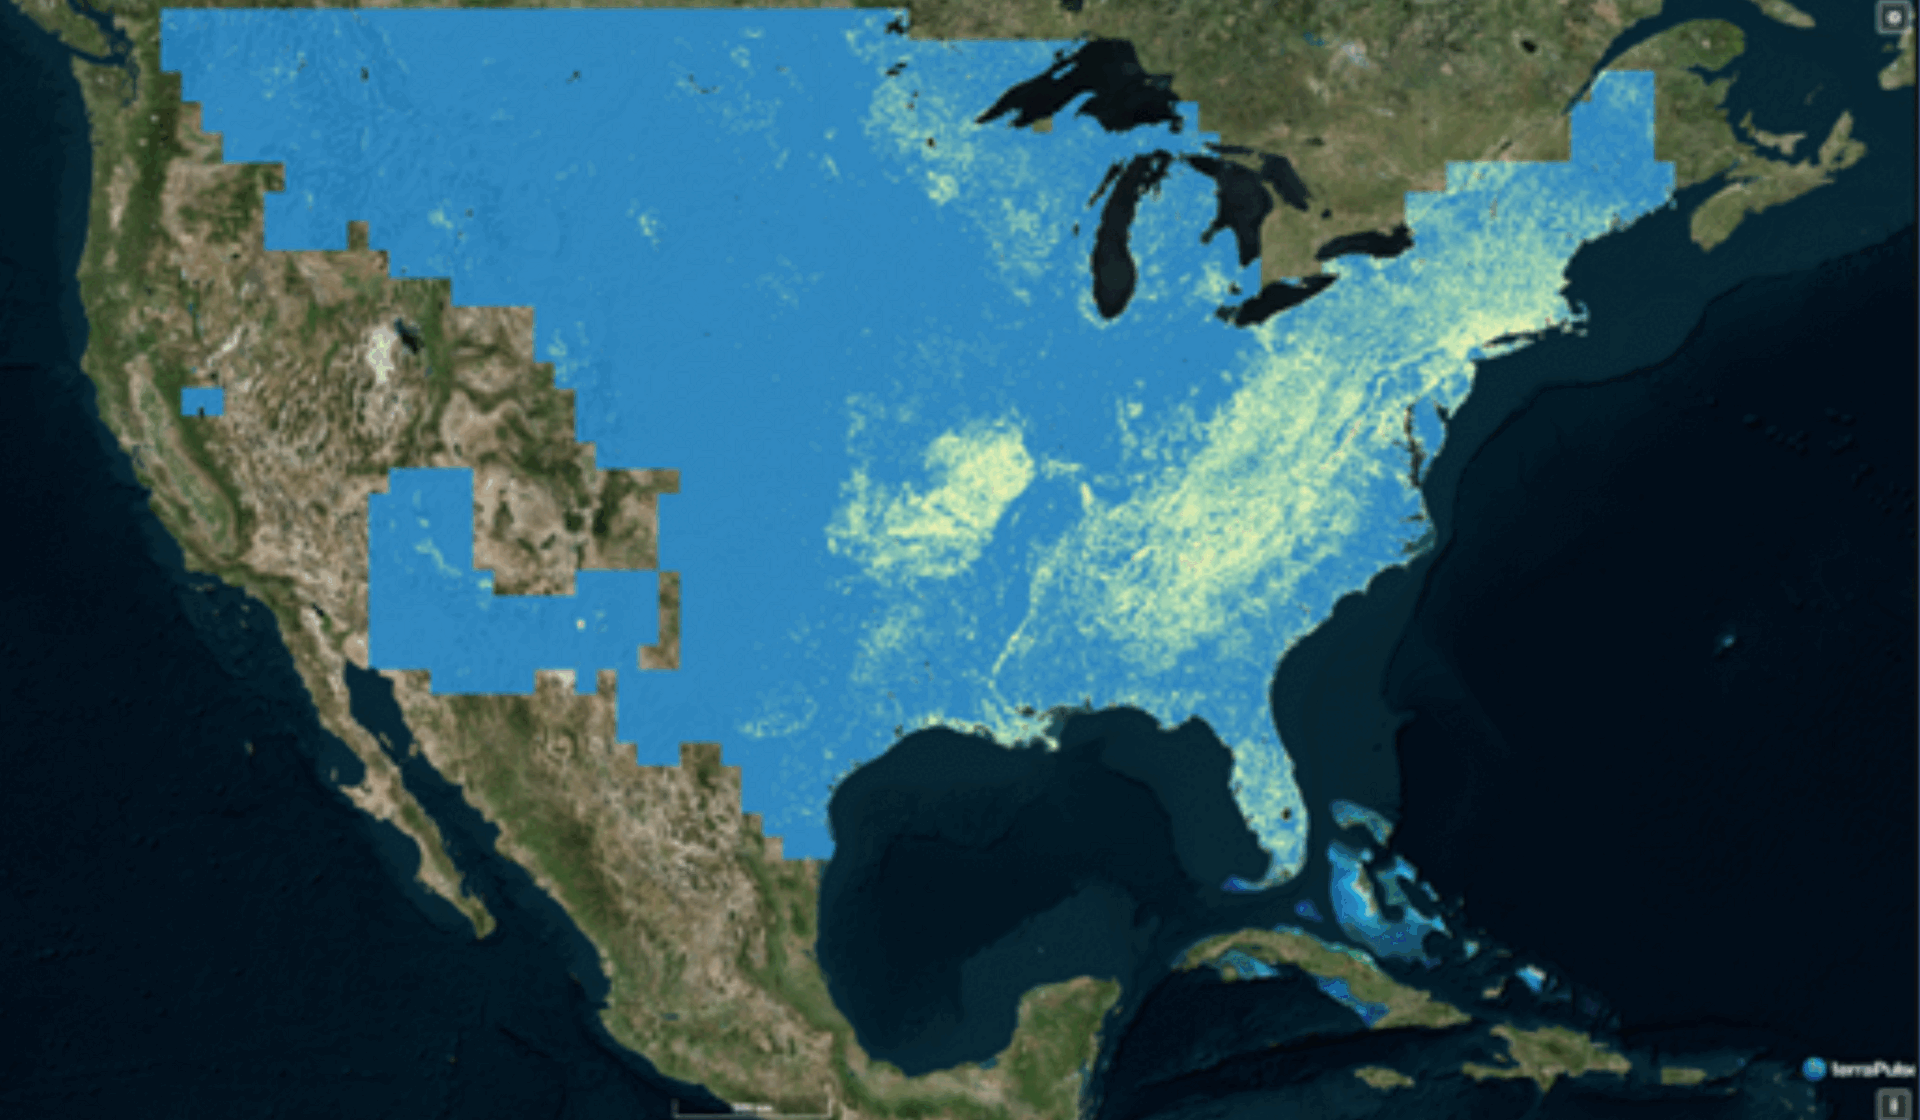
Water & Wetlands
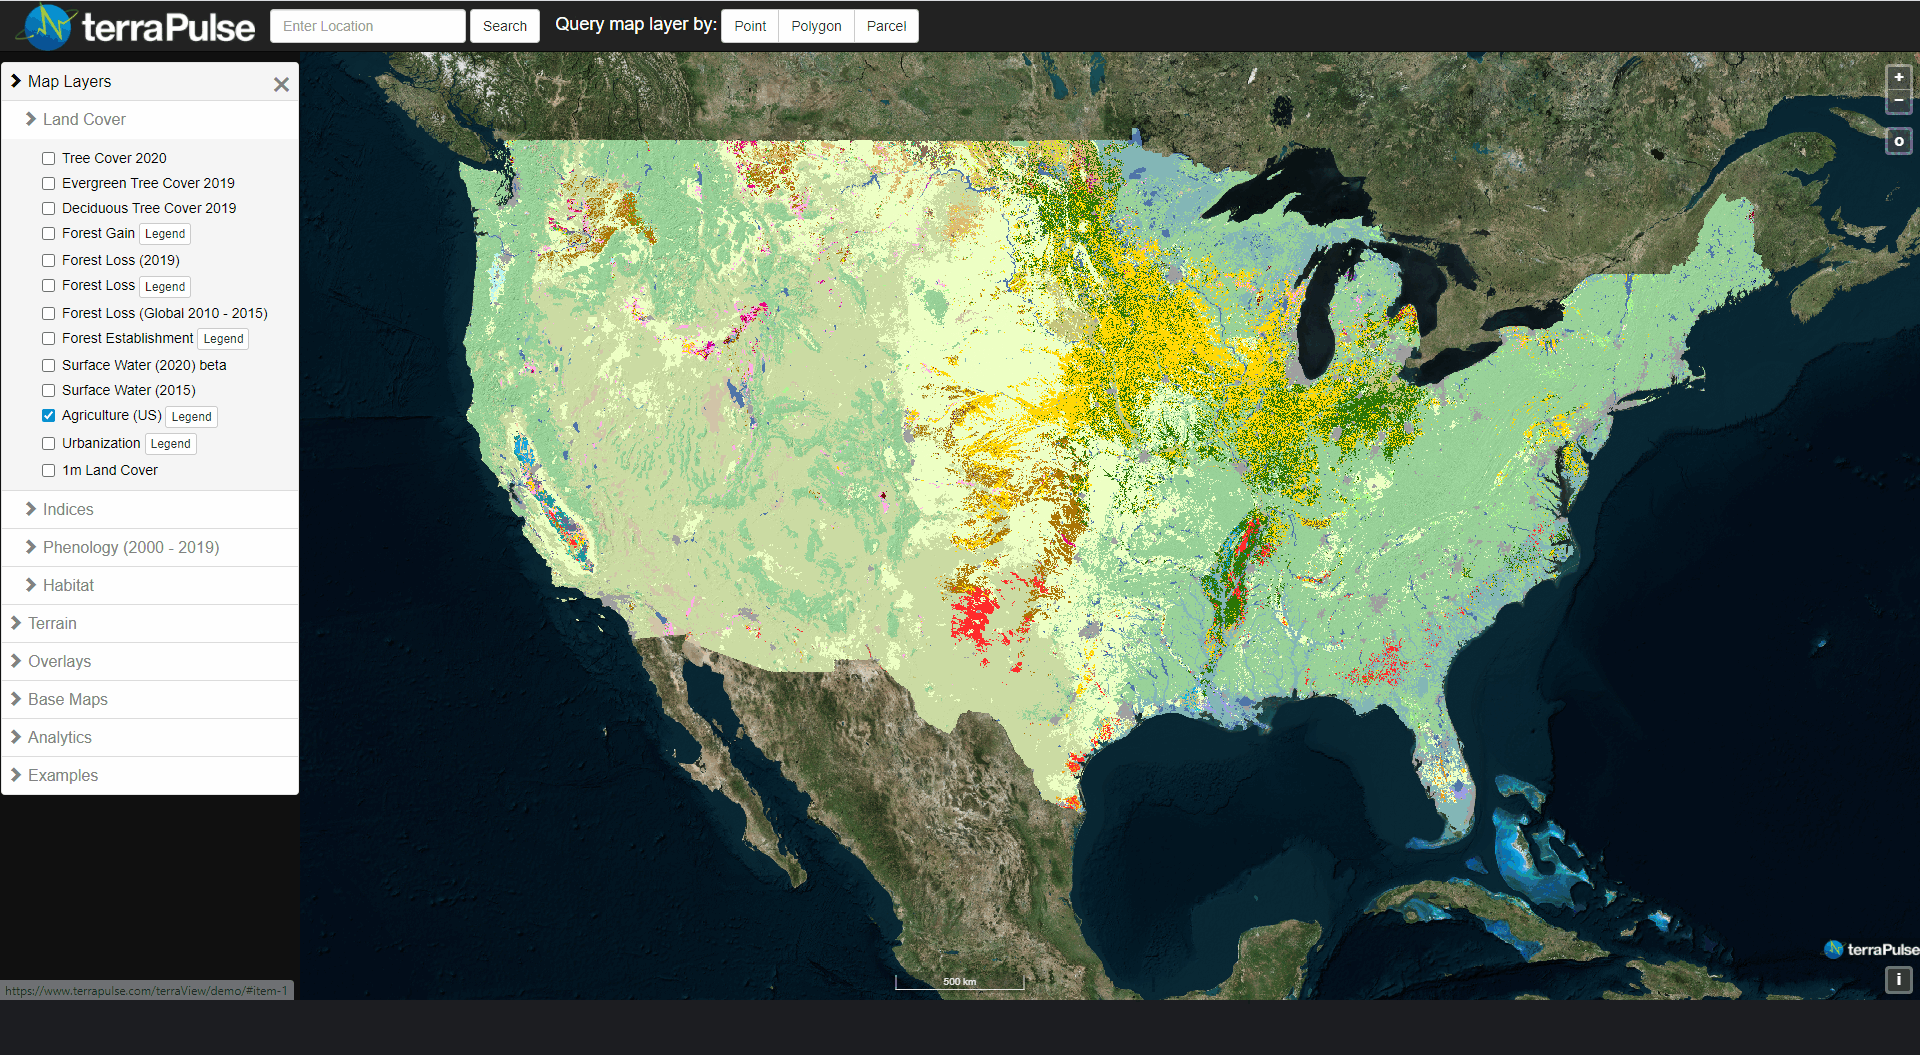
Range & Croplands
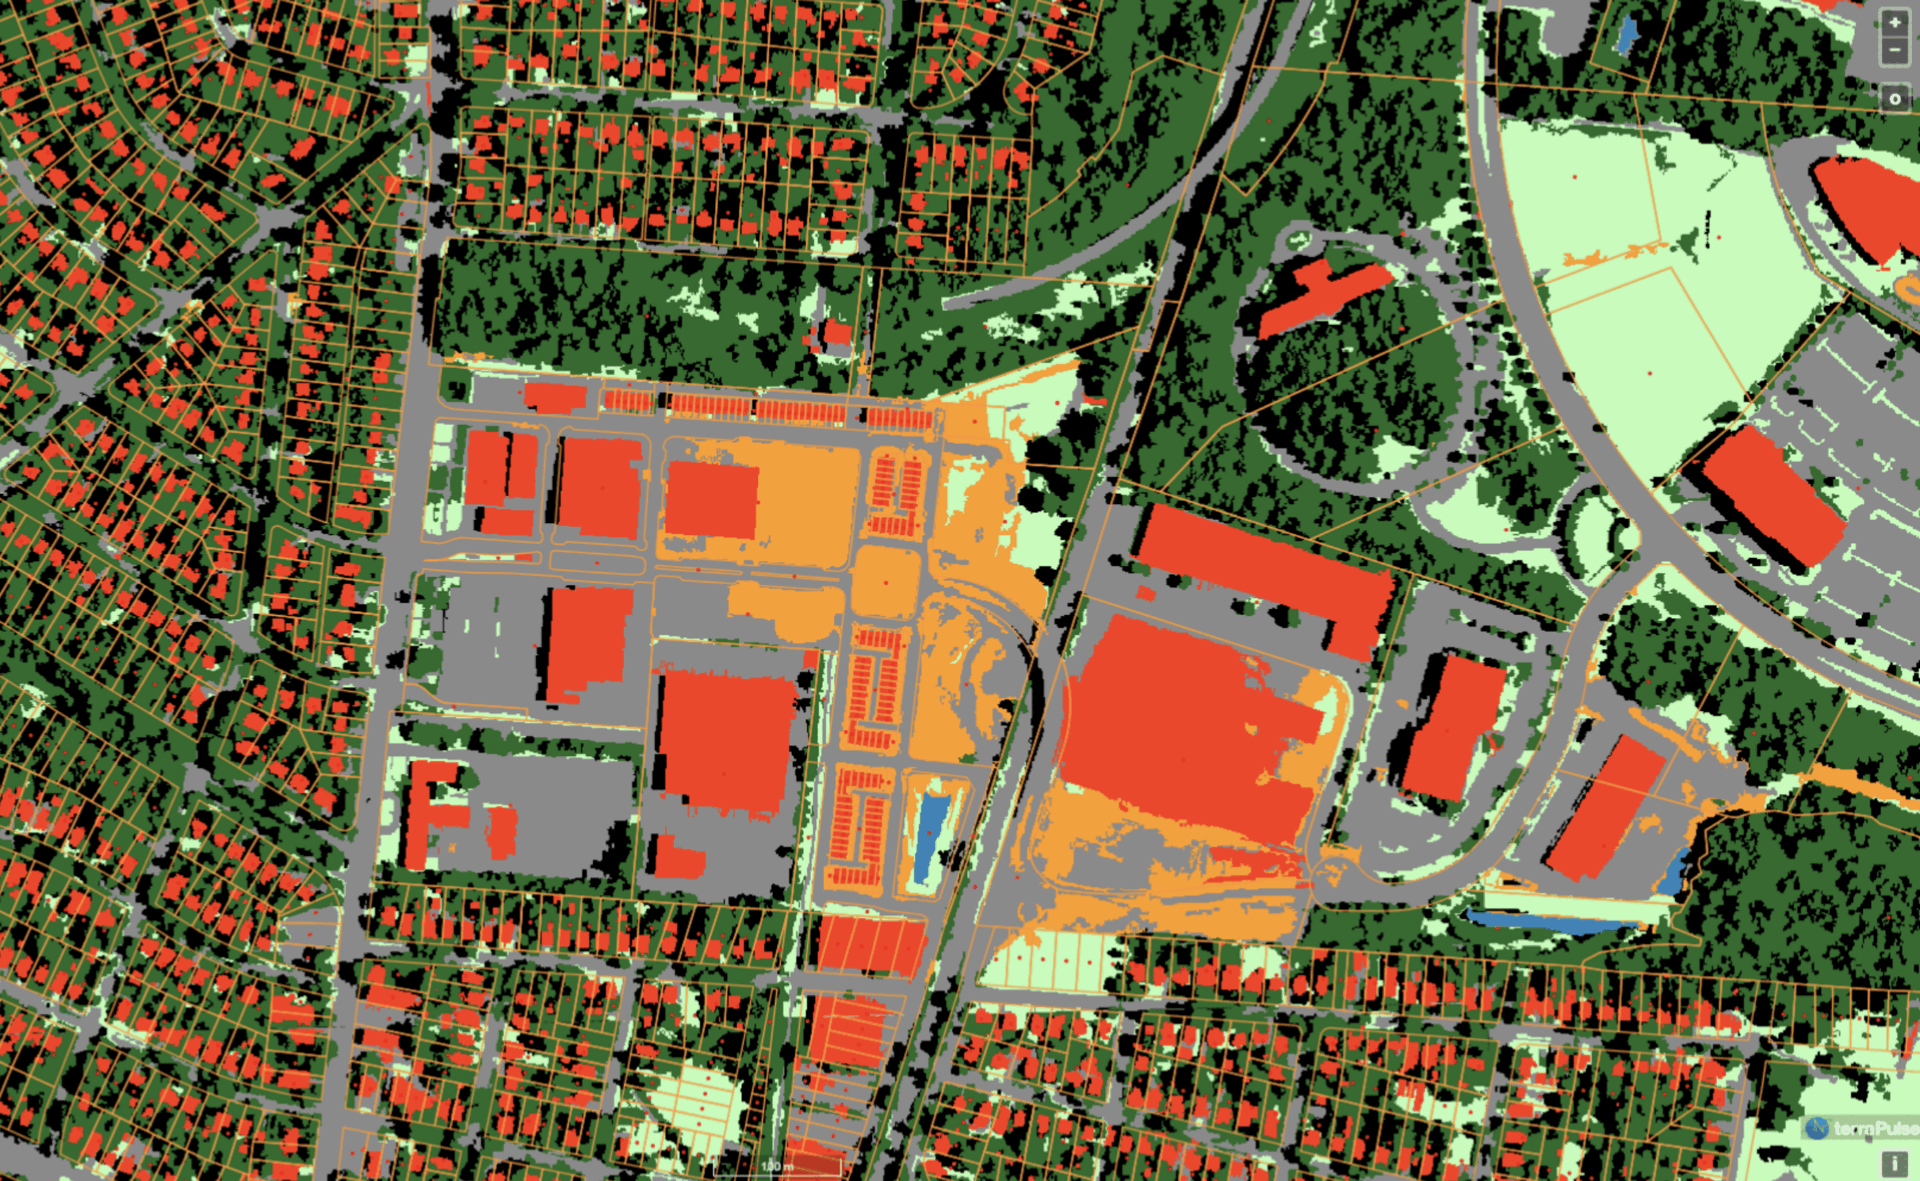
Urban & Developed
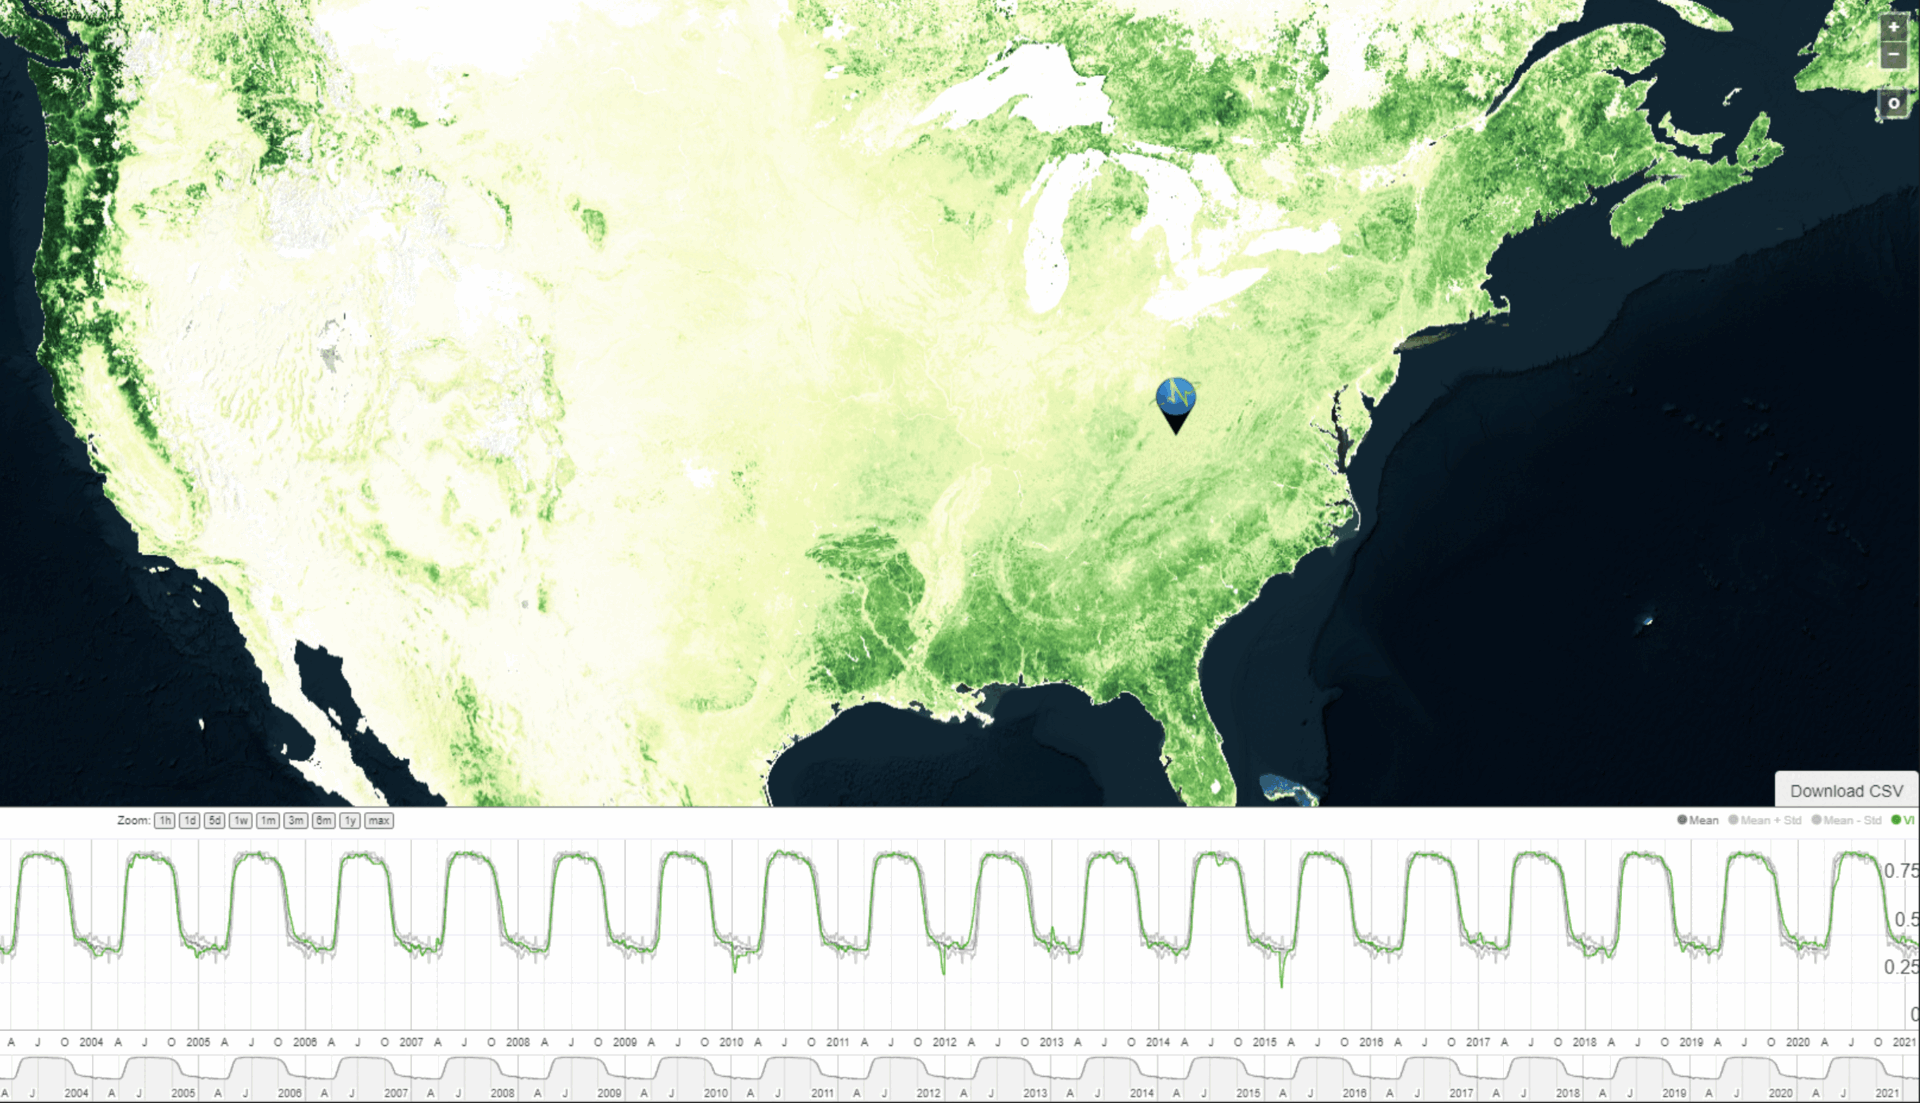
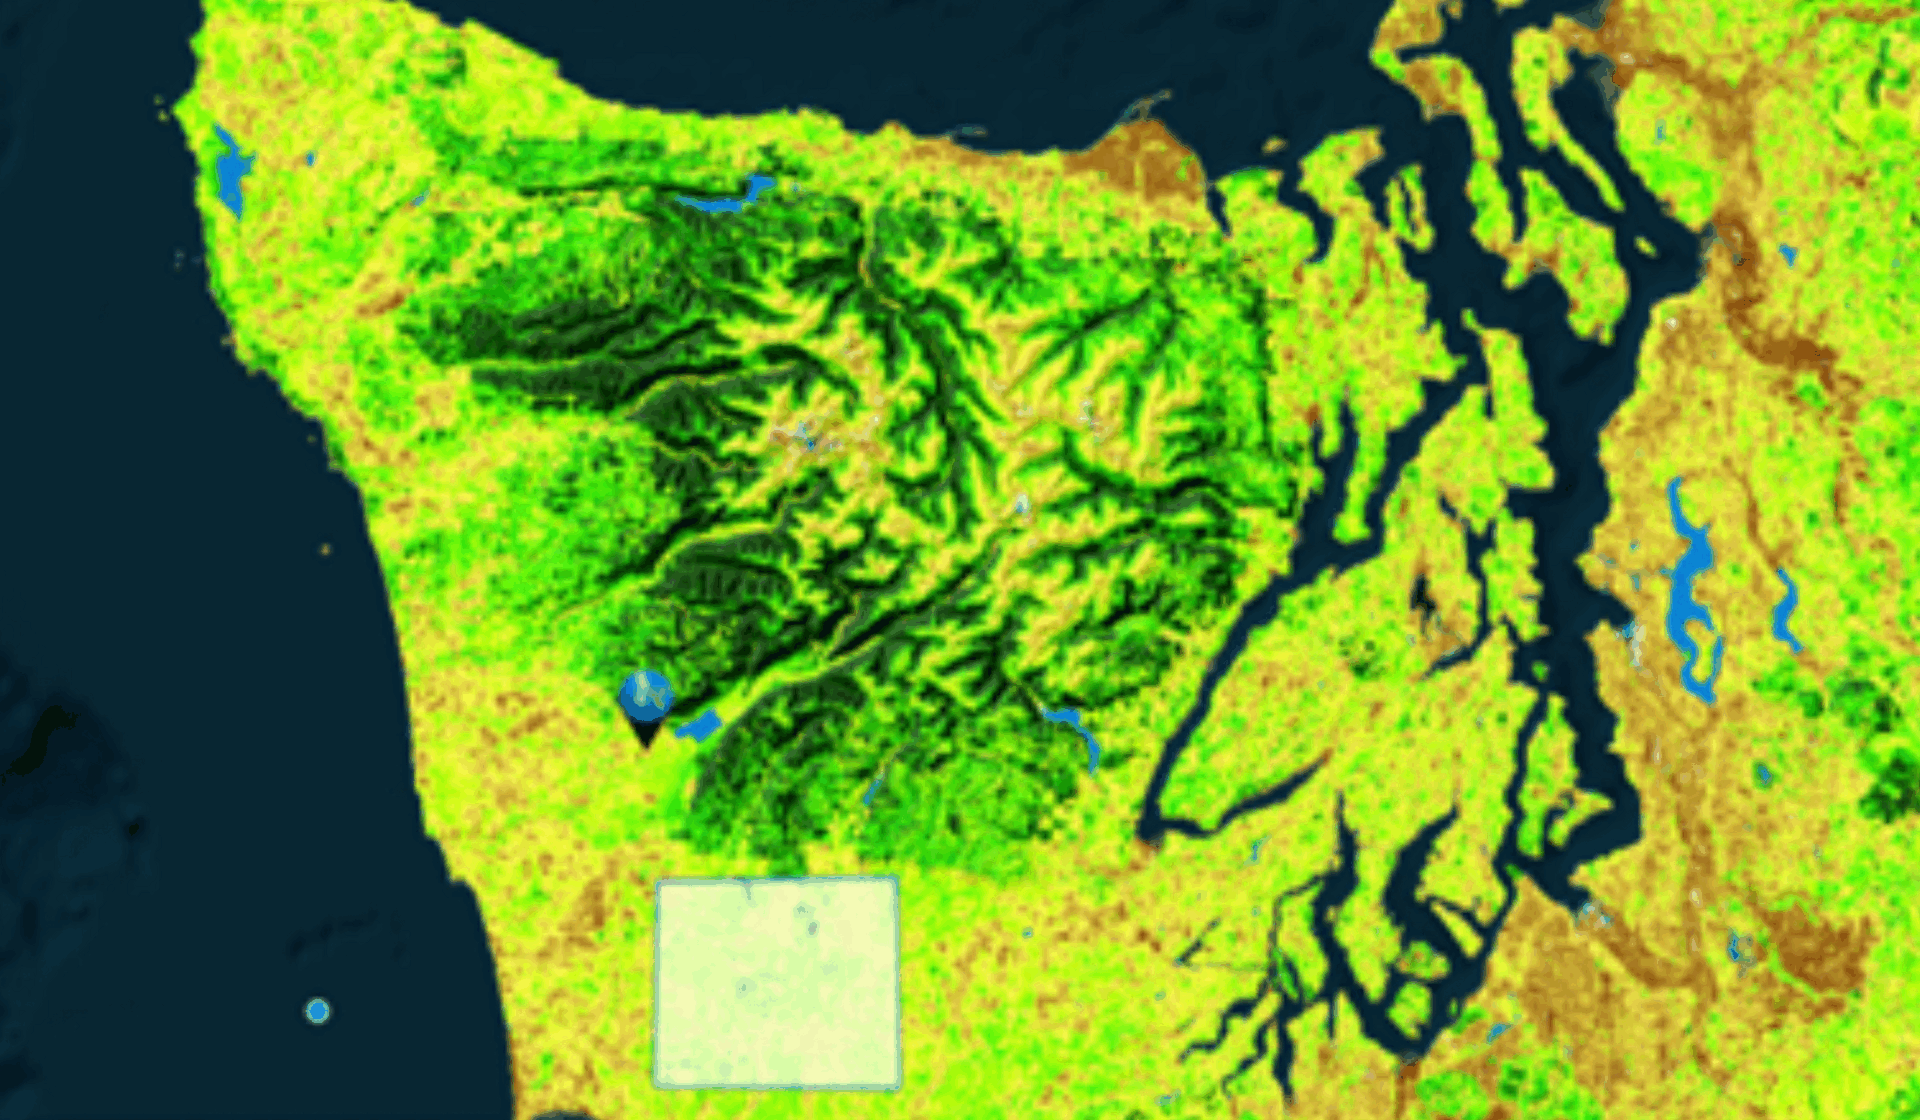
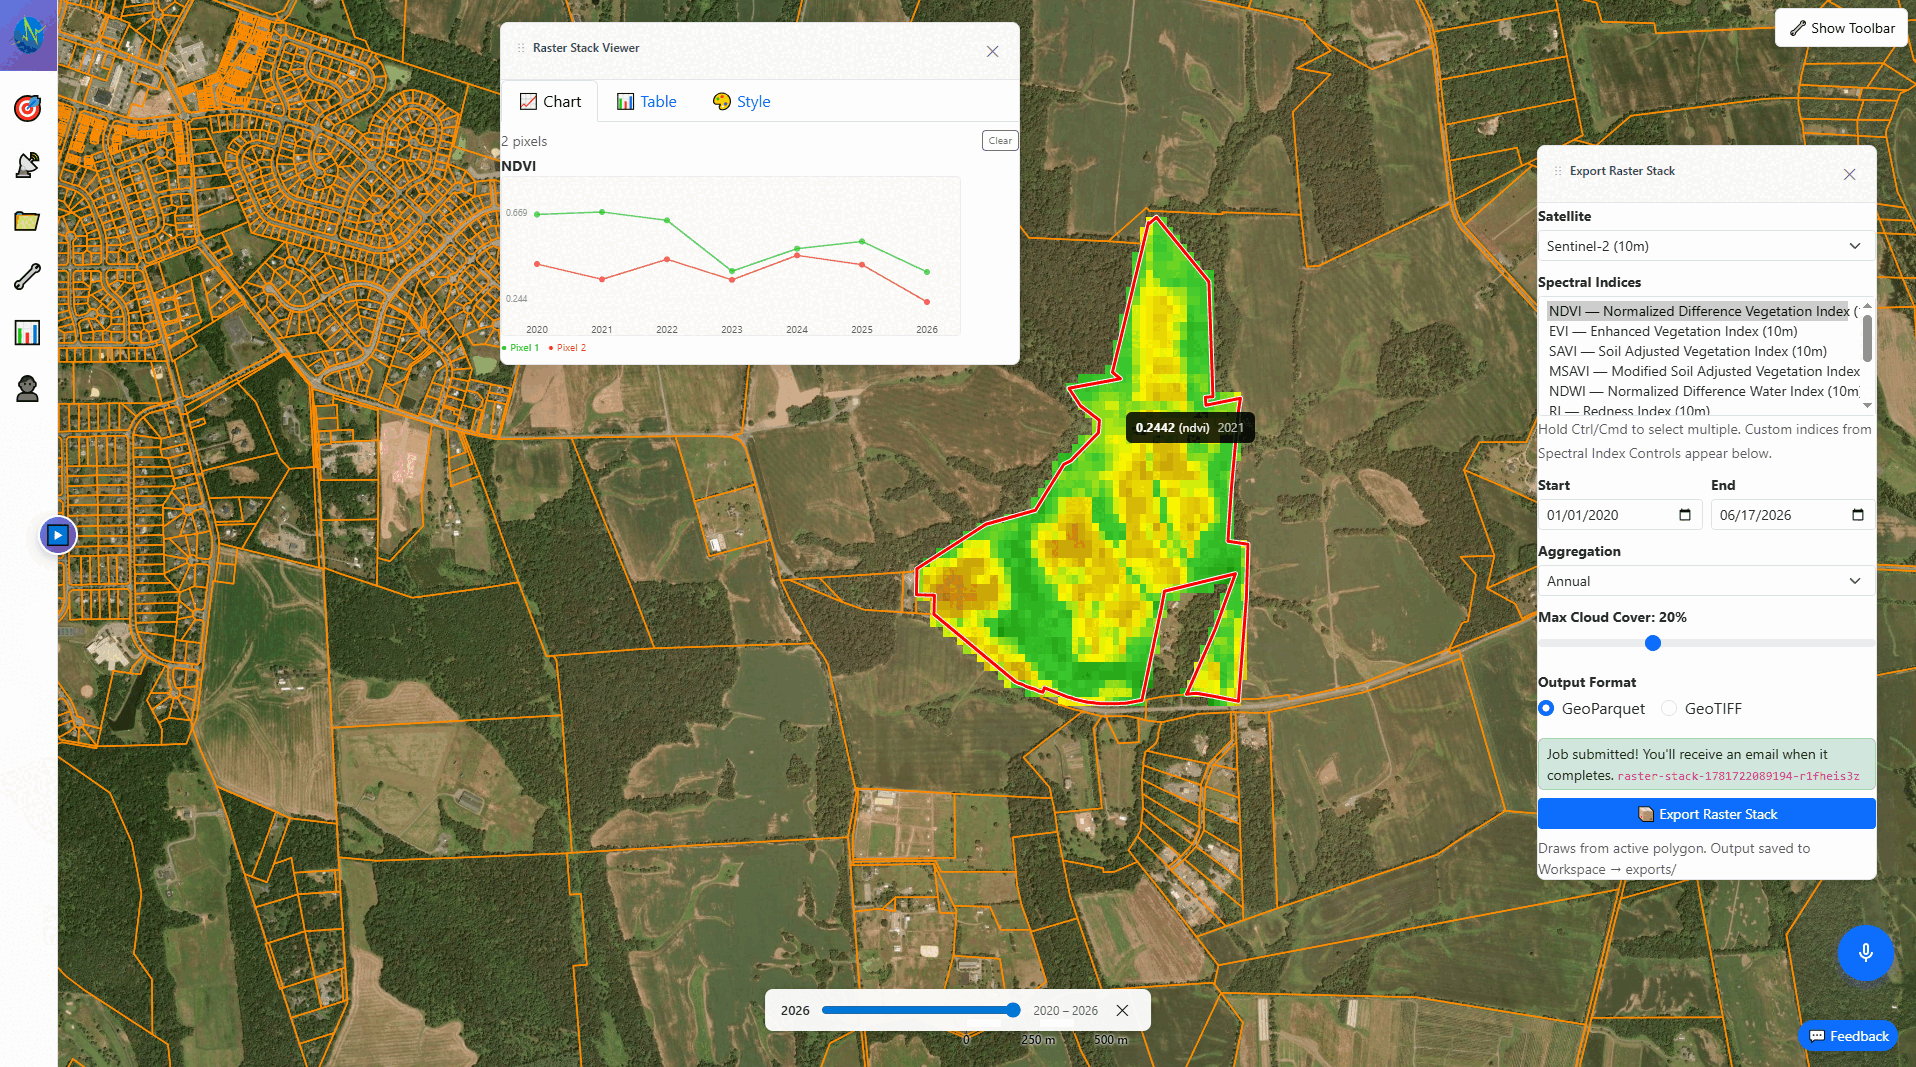
Indices & Seasonality
Biomass
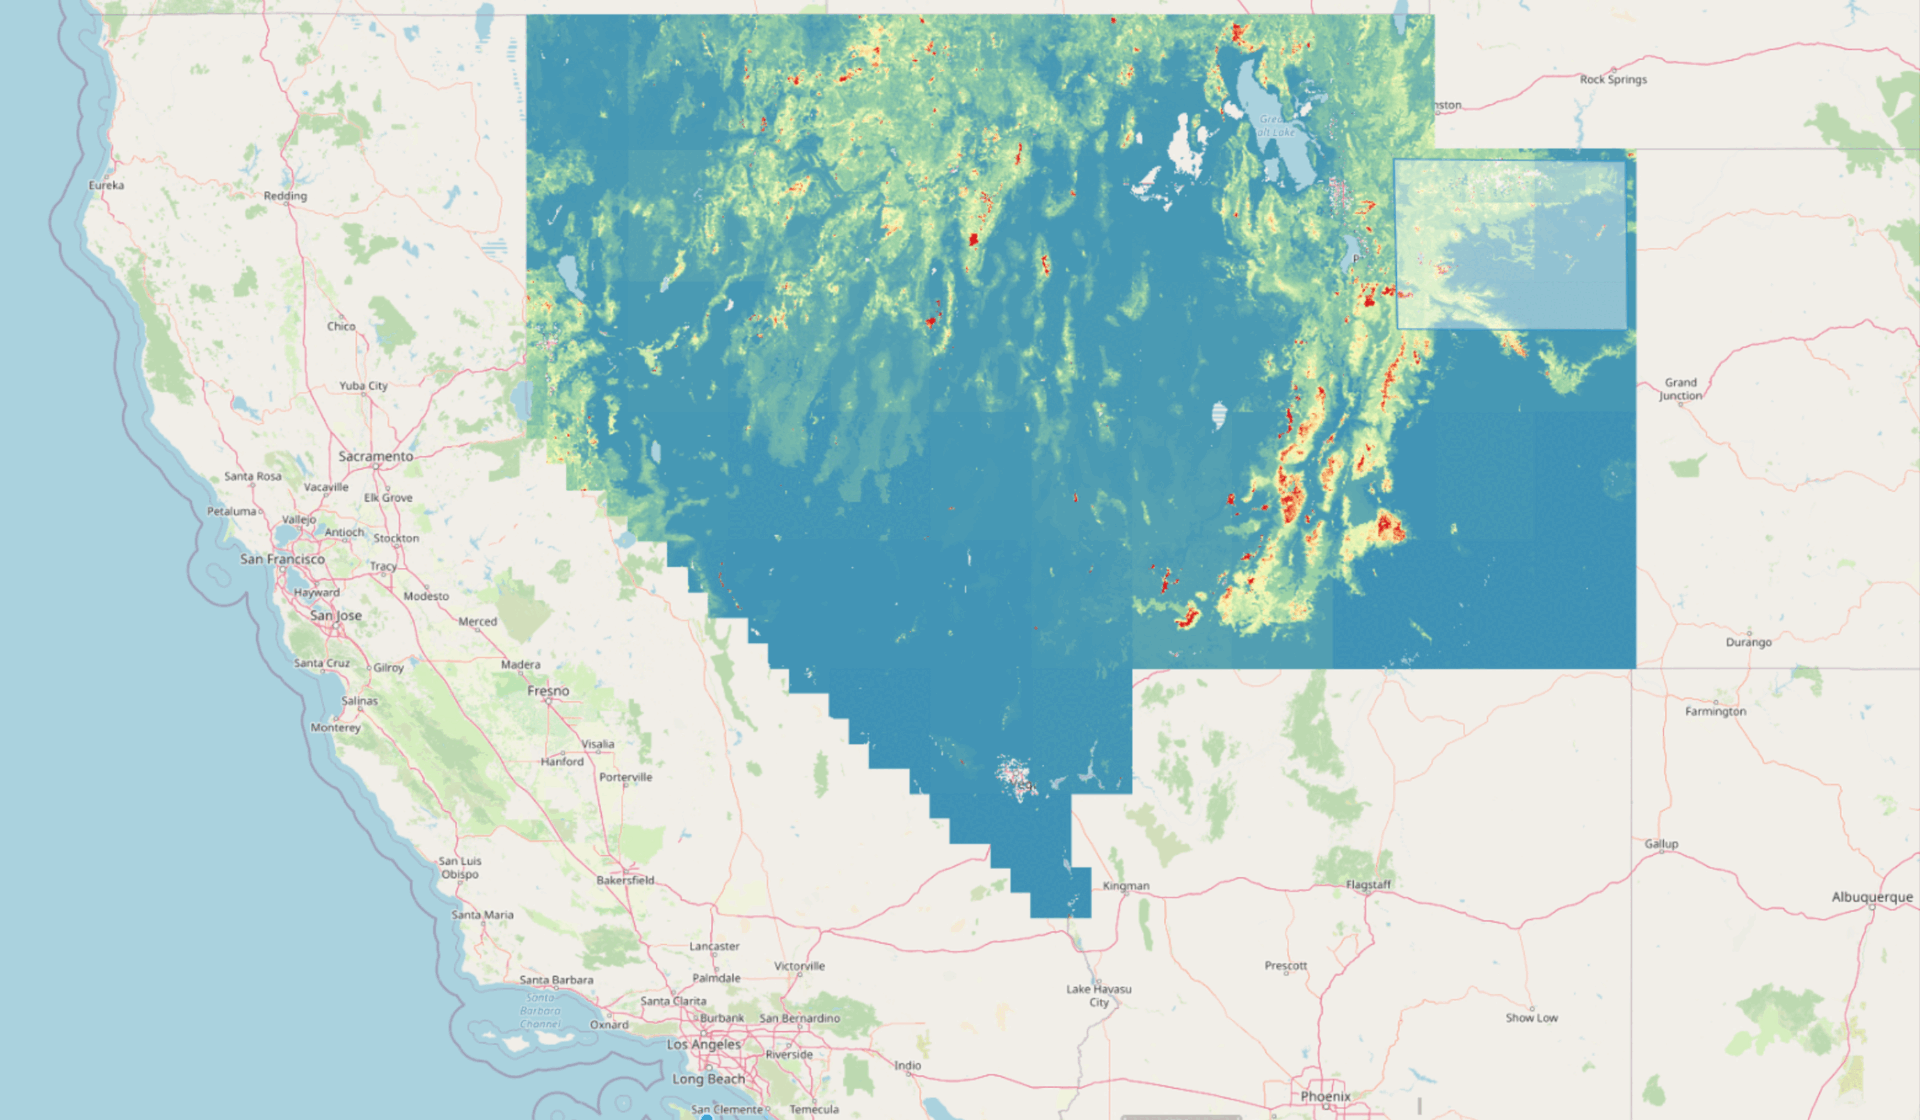
Wildfire
Species & Habitat
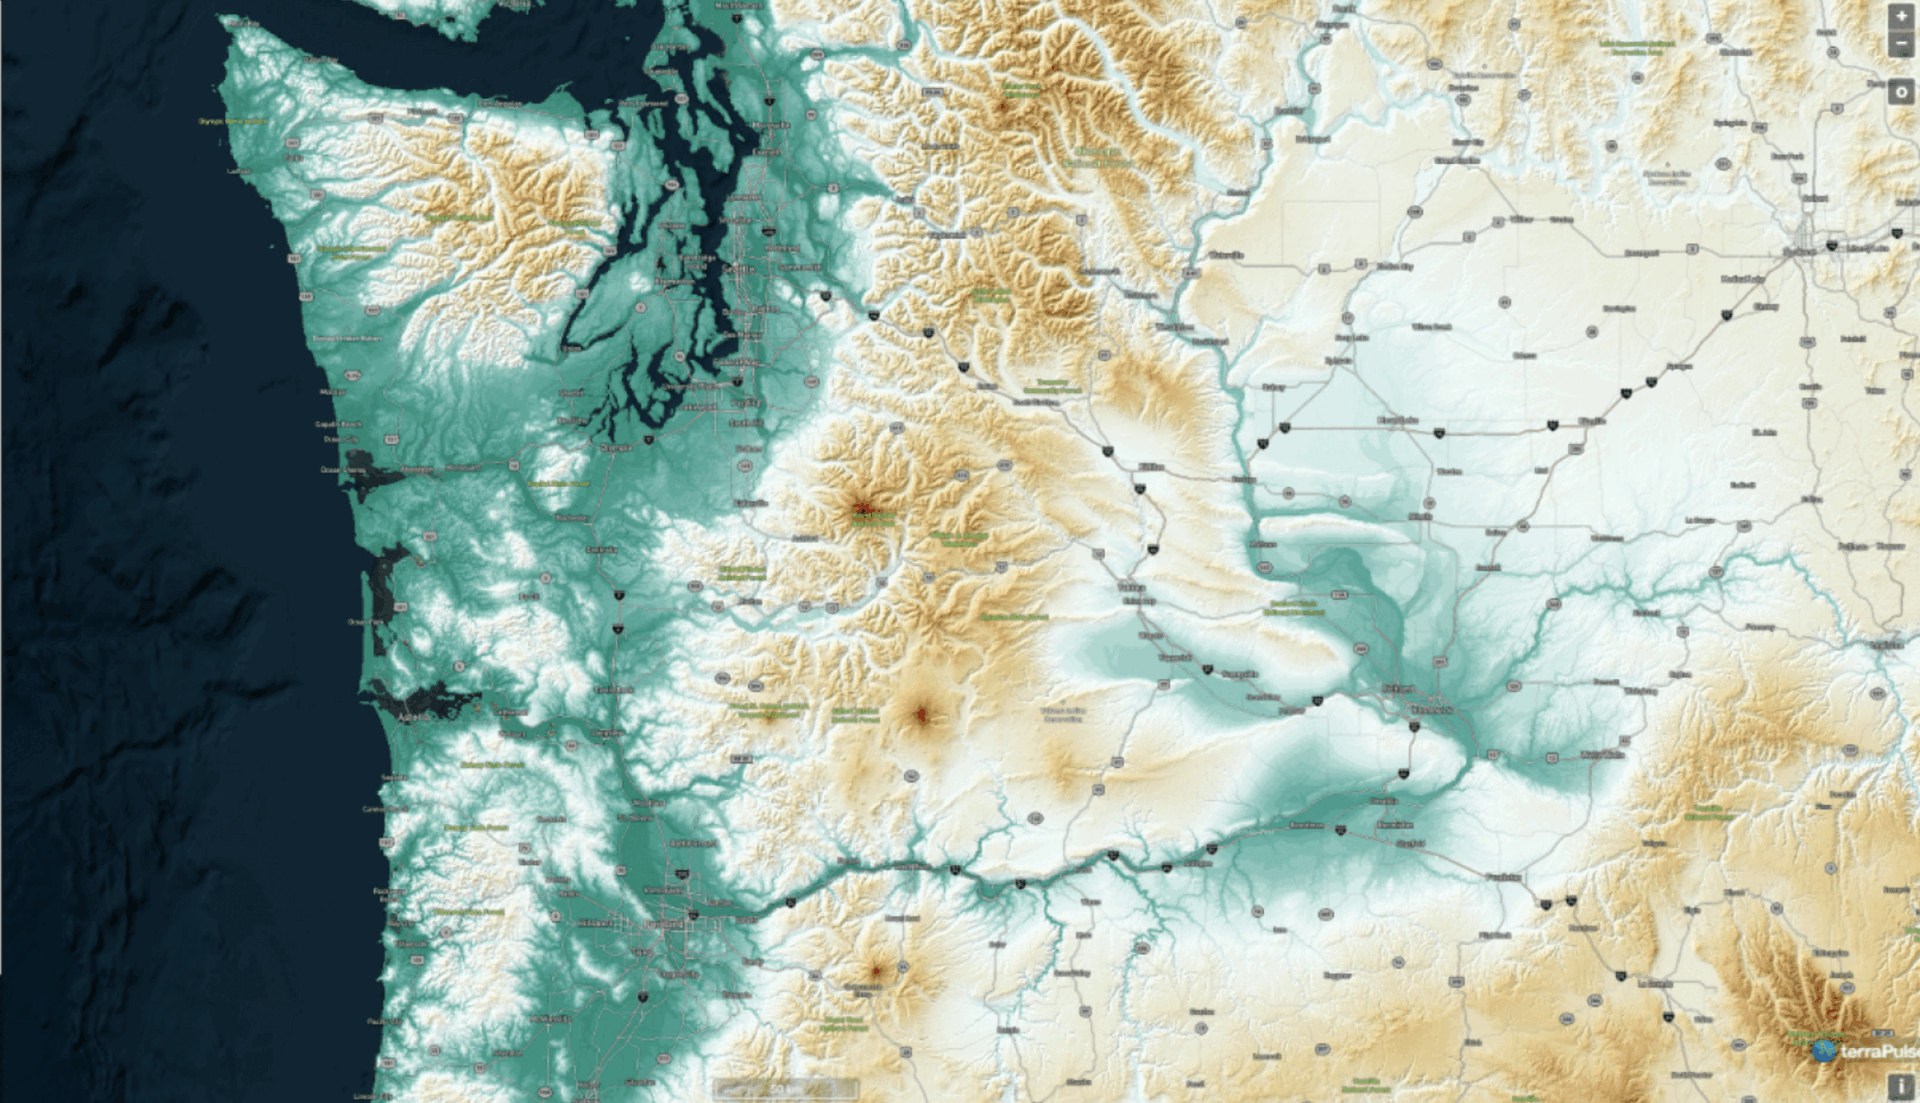
Terrain
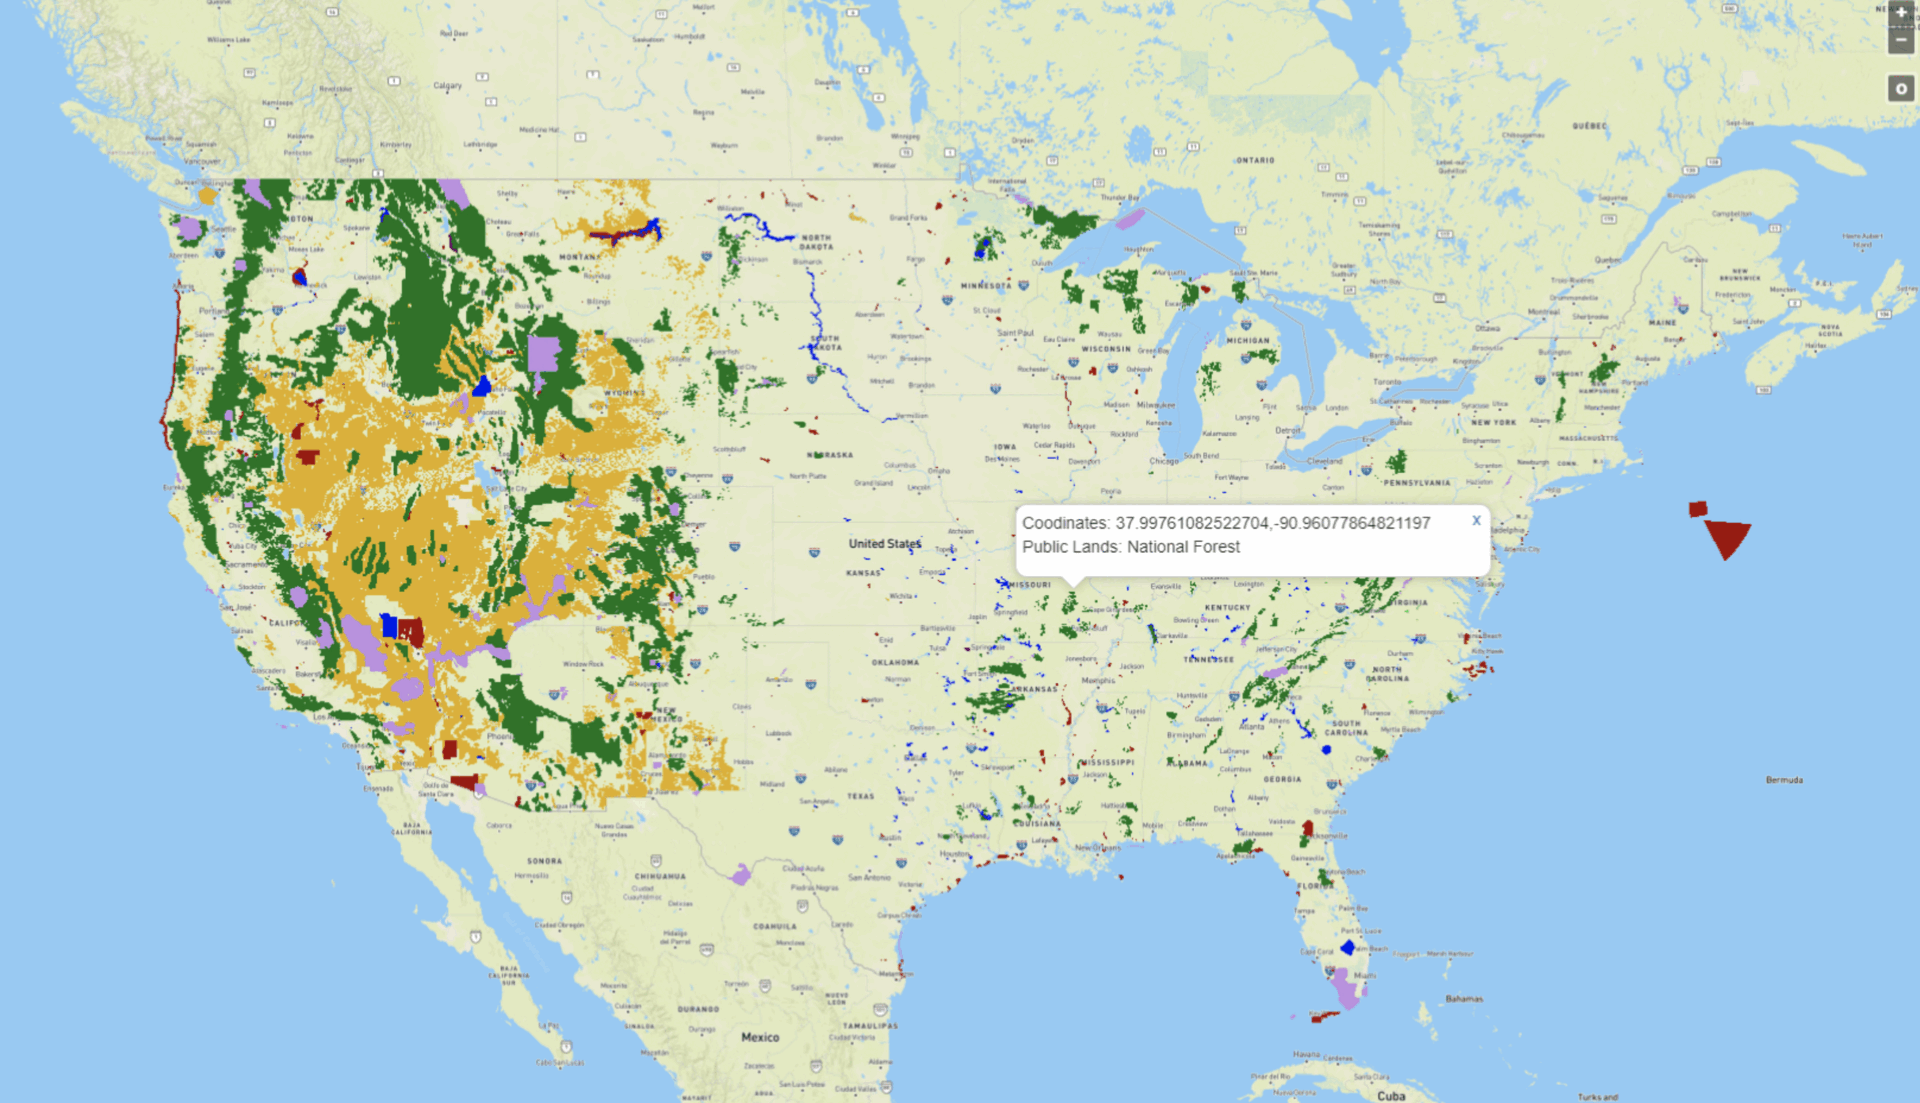
Ownership
terraPulse Data
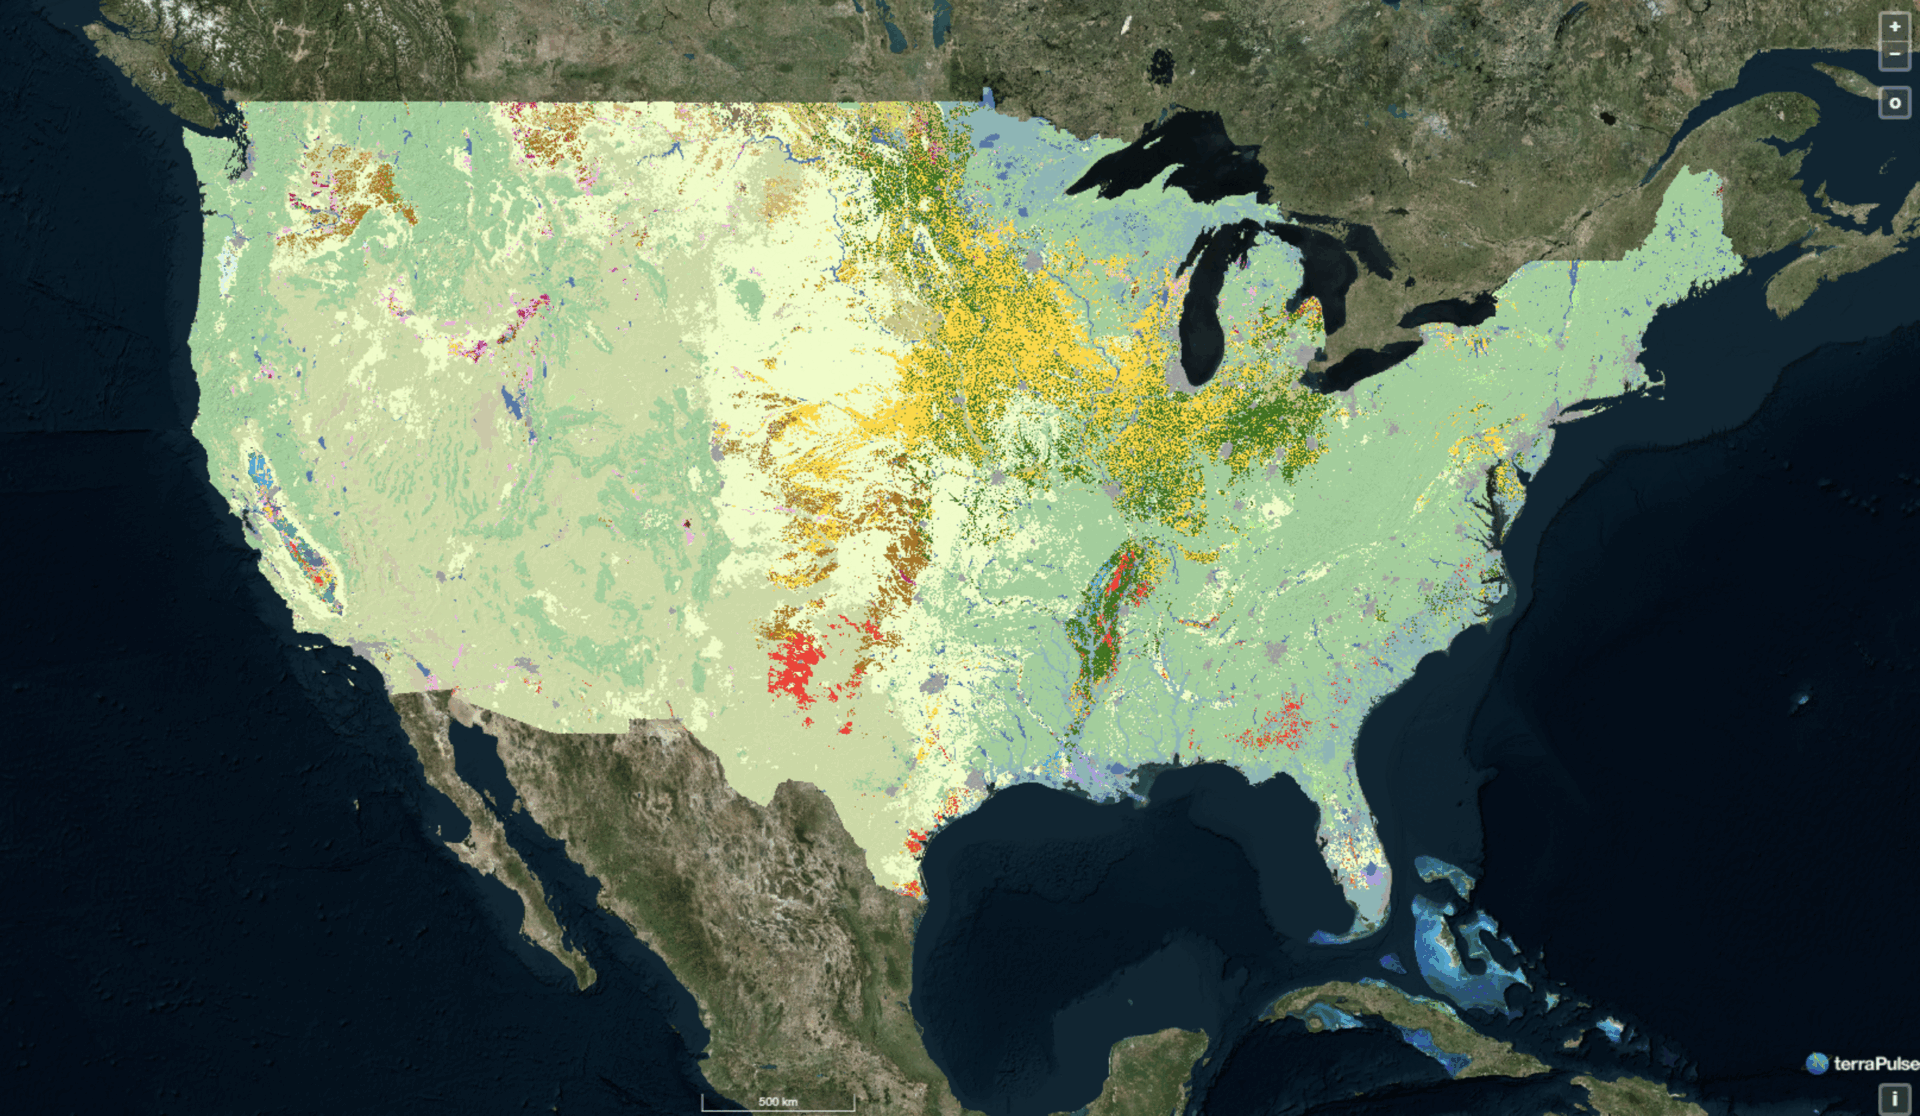
The terraPulse data cube is an empirical record of Earth’s biosphere. Mined from satellite measurements with machine learning, terraPulse datasets are gridded maps of the cover, structure, and function of ecosystems. The data are provided by location, from pixels and parcels up to the entire globe, and successive map layers depict changes over time. Spatial resolution ranges from 1 to 500 meters, at extents ranging from individual forest stands or property parcels up to the entire globe. Measurements are updated daily or annually, depending on the variable, and extend from 1984 to the present.
Tools & Features
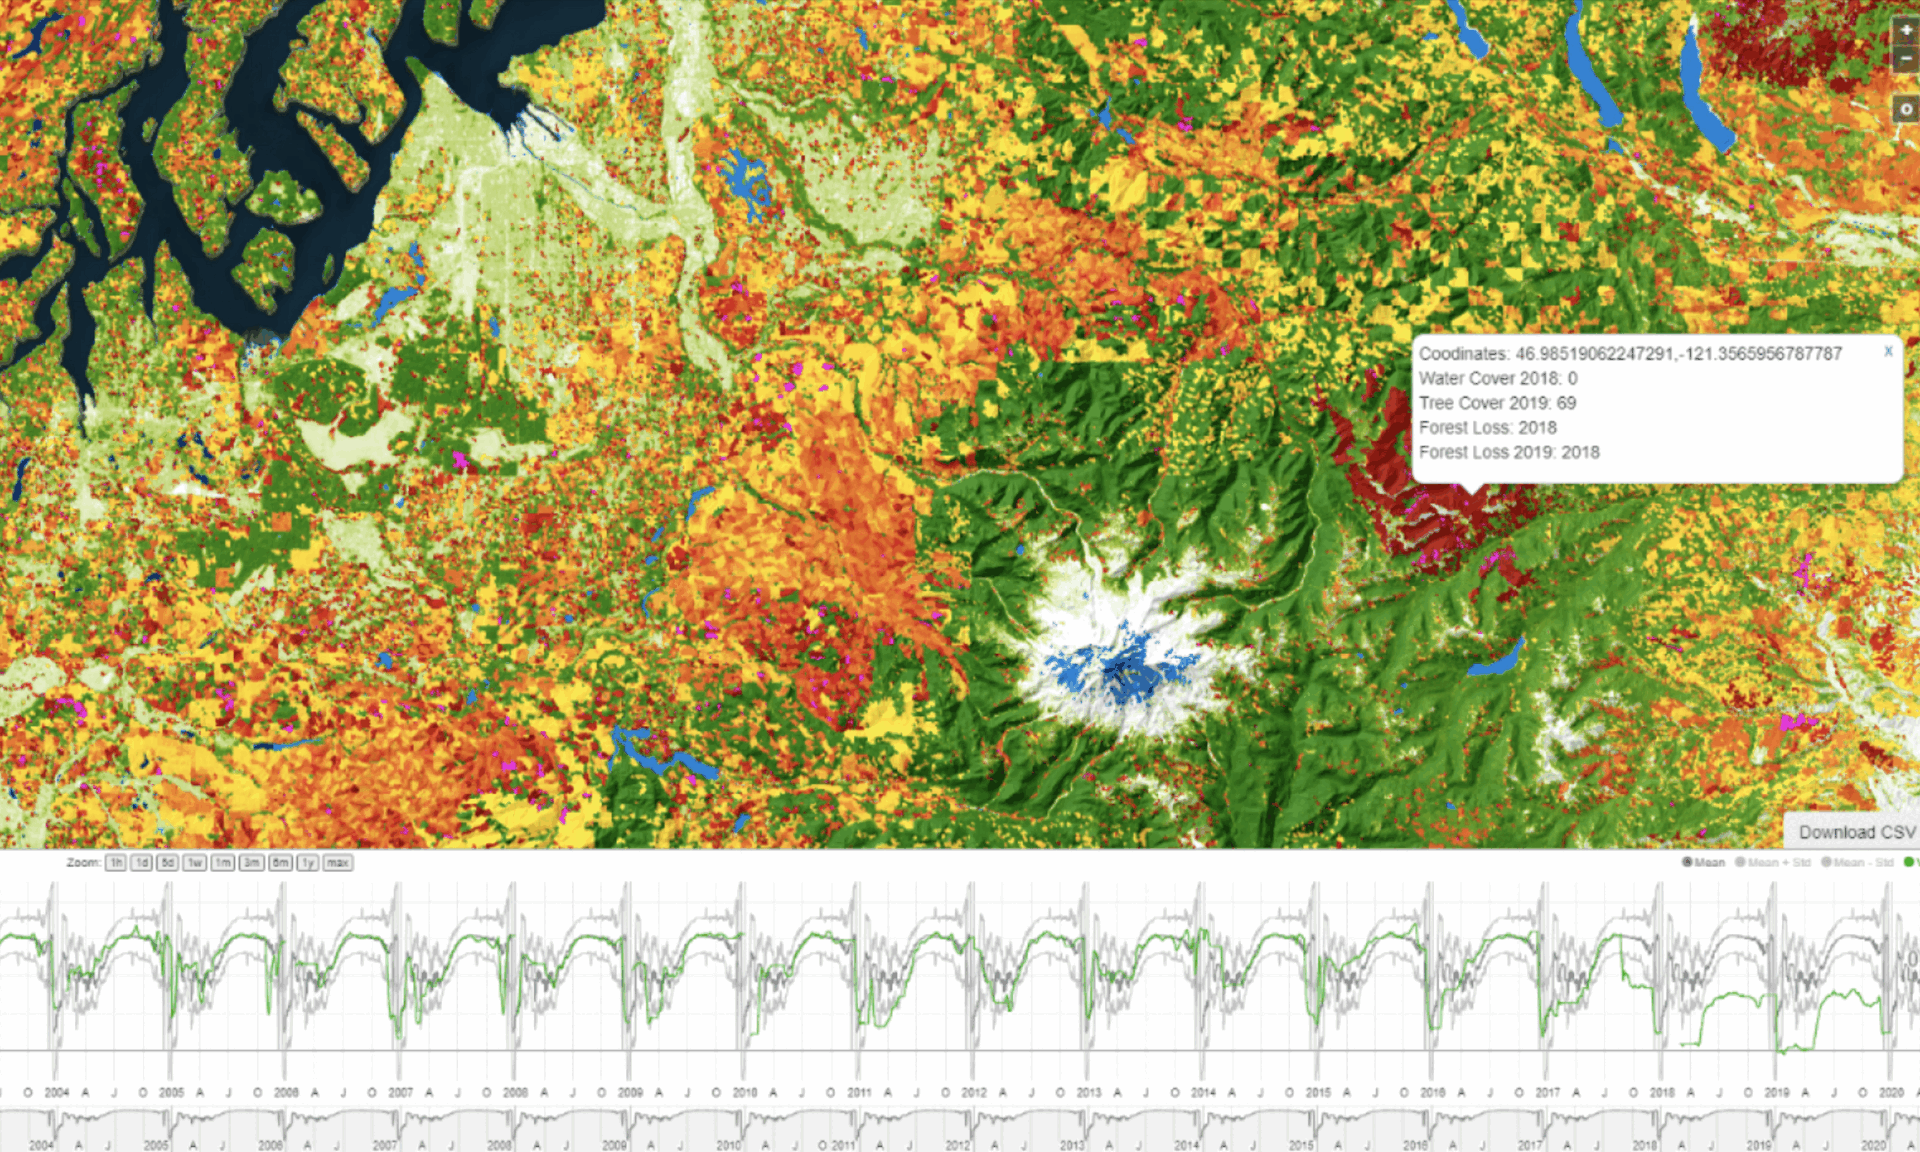
Most current value of each terraPulse map layer
- Map Pan & Zoom
- GPS & text location search
- Graphical and numerical point- and polygon summary
- Time-series index charts
- Roads & Boundaries
- Custom AOI’s (e.g., management units, supplied by user)
- Private accounts and data access
- Chrome preferred
layers
Most current value of each terraPulse map layer
- Roads & Boundaries
- Custom AOI’s (e.g., management units, supplied by user)
- Map Pan & Zoom
- GPS & text location search
- Graphical ad numerical point- and polygon summary
- Time-series index charts
- Private accounts and data access
- Chrome preferred
Dashboard
Land changes—so should your maps.
Based on streaming satellite imagery, calibrated to high-quality reference data, and built on the Amazon Web Services cloud platform for round-the-clock data storage, backup, and delivery, terraPulse enables access to the highest-quality information on land cover and its changes over time. Customized for each user, terraView displays a user-defined selection of map layers from terraPulse and other sources. Subset to a user’s geographic area at either pixel- or parcel-resolution, these datasets describe the history, status, and potential of each piece of land—from an individual parcel up to the entire globe—with global consistency and cutting-edge scientific accuracy.
Tools & Features
Most current value of each terraPulse map layer
- Roads & Boundaries
- Custom AOI’s (e.g., management units, supplied by user)
- Map Pan & Zoom
- GPS & text location search
- Graphical ad numerical point- and polygon summary
- Time-series index charts
- Private accounts and data access
- Chrome preferred
Tools & Features
Most current value of each terraPulse map layer
- Roads & Boundaries
- Custom AOI’s (e.g., management units, supplied by user)
- Map Pan & Zoom
- GPS & text location search
- Graphical ad numerical point- and polygon summary
- Time-series index charts
Private accounts and data access
Chrome preferred

terraServe API
The terraPulse data cube is a high-dimensional record of ecosystem dynamics. The cube can be subset spatially, temporally, or thematically to fit any study area, subject, and time span.
Whether as visual map tiles or numerical, science-grade values, the terraPulse data cube may be accessed through the terraServe Application Programming Interface (API). Numerical data are served in a variety of tabular and gridded formats, including CSV, JSON, and GeoTIF. Map tiles are exposed using XYZ tiles, where each tile is a 256 x 256 PNG using a EPSG: 3857 projection, enabling any terraPulse layer to be visualized through ArcGIS, QGIS, Google Maps, MapBox, Leaflet, OpenLayers, and other GIS and other mapping applications.
The terraServe API is available as a subscription service to developers and data scientists through individual or institutional accounts.
Increasing transparency and improving efficiency
Desktop & Mobile Maps
Visualize consistent, customized digital maps from the comfort of your office or while on-the-go in the field.
Cloud Storage & Access
Access terraPulse data streams to get the information you need automatically delivered to your application.
Custom Datasets
Attach comparable data across your listings to create a multidimensional view of the landscape.
Monitoring & History
Time-serial maps show the present landscape in the context of history and enable analysis of large-scale trends.
We answer all email and requests as they come in. If you have an urgent matter or would like to place an order please click the link below to give us a call.